Description of the dataset
The Iris dataset that can be downloaded here in the csv format holds 150
samples of 4 attributes of iris flowers. The attributes are the length and the width of the
sepal an petal in centimeters. For each dataset the type of the iris flower
(Iris setosa, Iris virginica or Iris versicolor) is also given. Each iris type has 50 samples in
this dataset. (A more detailed description can be found on
Wikipedia.)
This dataset is often used to test cluster or pattern recognition algorithms.
The usual task is to automatically detect the type of iris flower based on the 4 measures.
The dataset is suited for these tests because one type of iris flowers can be easily identified, while
the two remaining groups share similar values in all dimensions. Additionally information
visualization techniques have to be applied to illustrate this dataset, because its dimensionality does
not allow it to show all dimensions in one single 2D or 3D scatterplot.
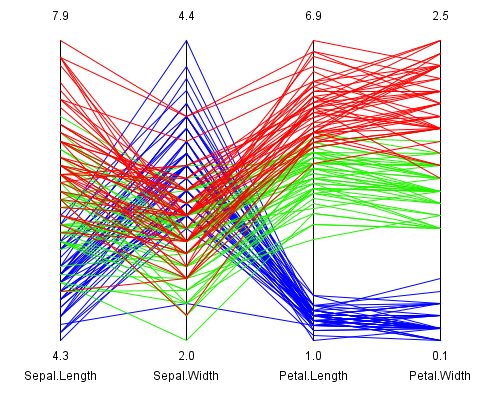
Picture 1: Visualization of the Iris dataset with parallel coordinates
The visualization with parallel coordinates shows the 4 measures colored by the type of iris flower.
The blue data lines represent Iris setosa, the green ones Iris versicolor and the red lines are the
samples of Iris virginica.
In this picture it can be seen that the petal length and width (= 3. and 4. dimension) can be used
to identify the blue group (= Iris setosa).
The dataset is also provided by programs like R. In R for
example only the command iris has to be entered and the dataset is prompted.
Cluster analysis
In the cluster analysis the task is to automatically detect groups, so called clusters, in datasets. Because the Iris dataset contains three types of flowers in the following example the k means cluster algorithm is applied on the 4 measures to detect the three groups. (A more detailed description of the k means clustering can be found here.)
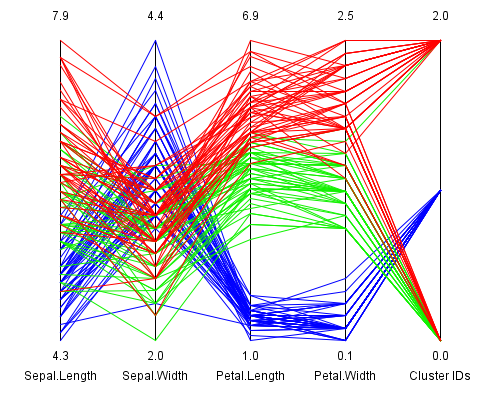
Picture 2: K means clustering of the Iris dataset
In this picture a fifth dimension - the calculated cluster
assignment - was added to the 4 measures of the dataset. The coloring of the data items
is the same as in picture 1.
It can be seen that the blue data items can be perfectly identified by cluster 1, while
the other two types of iris flowers are splitted up in the remaining clusters.
Cluster 0 mainly represents green data items (= Iris versicolor) and cluster 2 contains
mainly data of Iris virginica. But no perfect identification can be made by the clustering.
The dataset with the result of the clustering of picture 2 can be downloaded
here.
It has to be stated that the k means clustering strongly depends on the initial cluster
centers. Usually the initial centers are randomly chosen data items. Different
starting conditions lead to significantly different clustering results. In picture 3
an alternate result is shown, where no cluster perfectly fits a type of iris flowers.
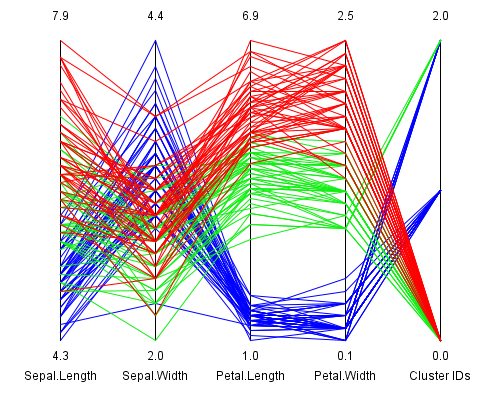
Picture 3: Alternate k means clustering
Dimension reduction with PCA
With the Principal Component Analysis (PCA) a high percentage of the variance in the data can be captured in a few "artificial" attributes, which are linear combinations of the original dimensions. For this example the two first principal components are used to reduce the dimensionality of the Iris dataset by keeping 97.8 % of the variance in the data. The resulting new dimensions are then visualized in a two dimensional scatterplot. (A more detailed description about the PCA can be found here.)
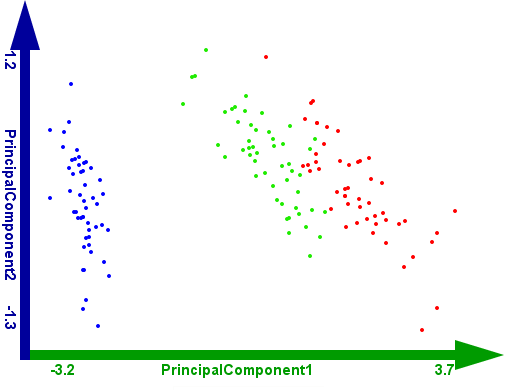
Picture 4: The first two principal components of the Iris dataset
The dataset with the first two principal components can be downloaded here.
References
The Iris dataset is currently used on the following pages:
|
|
Visualization - Statistical analysis with parallel coordinates
(Winter term 2005/06) |