| « Task | k means Clustering » |
Data selection in linked views
The term linked views means that an application has several visualizations.
Interactions that are applied to one of those views automatically affect the other views.
On this page an example is
given with a parallel coordinates and a two dimensional scatterplot view.
The following images show visualizations of the Iris dataset
in a scatterplot and a
parallel coordinates view. (More information about this dataset can be read
in this article and
in the section
k means Clustering.)
While the scatterplot only shows the first two attributes, the parallel coordinates give insight into all
6 dimensions of the dataset.
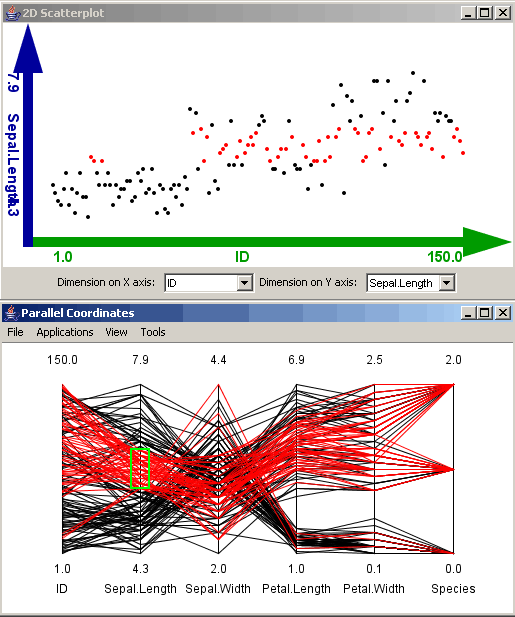
In the first image a data selection was drawn on the second dimension in the parallel coordinates view.
The selected data items are highlighted red. This highlighting is also used in the linked scatterplot.

Picture 1: Linked Views - Selection in parallel coordinates
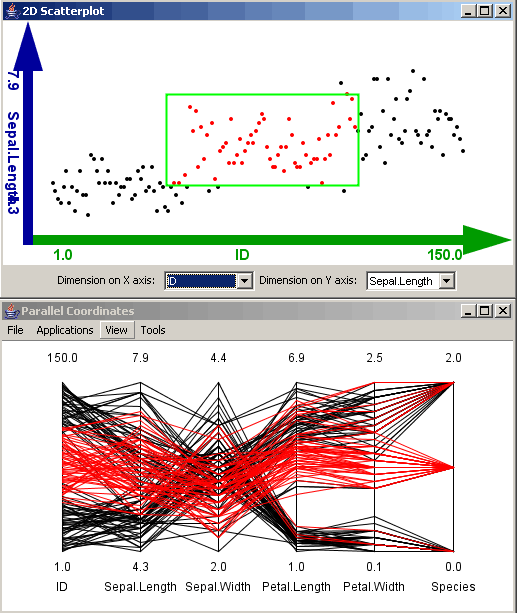
In the second picture data was selected in the scatterplot. In this selection the first two dimensions are considered. The colored highlighting is also immediately visible in the parallel coordinates visualization.

Picture 2: Linked Views - Selection in scatterplot
| « Task | k means Clustering » |