A program written for the lecture
Informations visualisation (summer term 2004)
Michael Wohlfahrt, 9825026
Jürgen Platzer, 0025360
| « Description of the ThemeRiver | Visualization examples » |
Functionality of the program
Starting the program
Our program was written in Java. At the time we developed this application
the Java Development Kit 1.4.2_01 was used.
On this webpage we provide the source code
(themeriver_source.zip)
as well as the compiled files (themeriver.zip).
(These files were compiled on Windows XP with the JDK 1.4.2_01.)
To compile the program the files have to be extracted into a directory (e.g.
C:\ThemeRiver).
Afterwards the following commands have to be executed:
        javac -classpath "C:\ThemeRiver" *.java

        javac -classpath "C:\ThemeRiver" data\*.java

        javac -classpath "C:\ThemeRiver" drawing\*.java
To start the program the command
java -classpath "C:\ThemeRiver" ThemeRiver
has to be executed in the directory, in which the file ThemeRiver.class is stored.
Afterwards the following window appears on the screen.
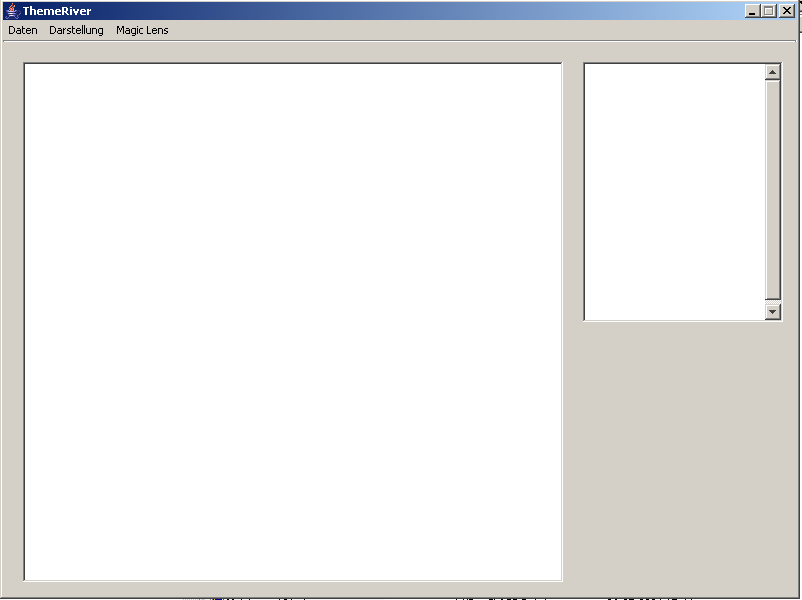
Picture 2: Screenshot of the program
The menu data
To create a first visualization a dataset has to be loaded.
By using the menu data / load or the shortcut
ctrl+o a text file in the csv format
can be loaded. The semi colon is used as separator. The data format is here:
      <Time unit>;<Attribute 1>;<Attribute 2>;...;<Attribute n>
      <Point in time 1>;<Numerical data attribute 1>;<Numerical data attribute 2>;...;<Numerical data attribute n>
      <Point in time 2>;<Numerical data attribute 1>;<Numerical data attribute 2>;...;<Numerical data attribute n>
      ...              ;...                         ;...                         ;...;...
      <Point in time m>;<Numerical data attribute 1>;<Numerical data attribute 2>;...;<Numerical data attribute n>
By calling the menu data / export image the current visualization can be saved as
JPG or PNG image. For the image generation the current export properties are used. These can be changed in
the menu data / export properties.
The menu visualization
In this menu several configurations concerning
- the borders of the rivers (i.e. the kind of interpolation)
- and the visualization of the data points
can be made. Additionally the mode can be switched between the classic ThemeRiver and
a histogram visualization.
The menu visualization / color properties opens a window to modify, save and load colors for the rivers.
The menu Magic Lens
When the menu Magic Lens / Create is called, an area in the current
visualization is created, in which a different visualization
style is shown. The visualization in this area can be steered in the
Magic Lens menu. The area can be moved by dragging it with the mouse.
When the black border surrounding the area is dragged, the magic lens
can be resized. The area can be removed by using the menu Magic Lens / Delete.
| « Description of the ThemeRiver | Visualization examples » |